-
Diversity Still Matters카테고리 없음 2022. 12. 17. 20:47
School-level Racial Diversity, Poverty and Performance of New York City Public Schools
by David Byunghwa Kim

Figure 1: Manhattan, New York City (Klook, 2022) The city of New York has a population of 8.4 million, making it one of the largest cities in North America. One third of its population was born outside of the United States, and it is estimated that 800 different languages are spoken there, making it the most linguistically diverse city in the world. Neighbourhoods, restaurants and cultural centers sit side by side, celebrating ethnicities from all over the world. In fact, due to its large size and population, as well as its multicultural nature, the United Nations headquarters are located in New York.
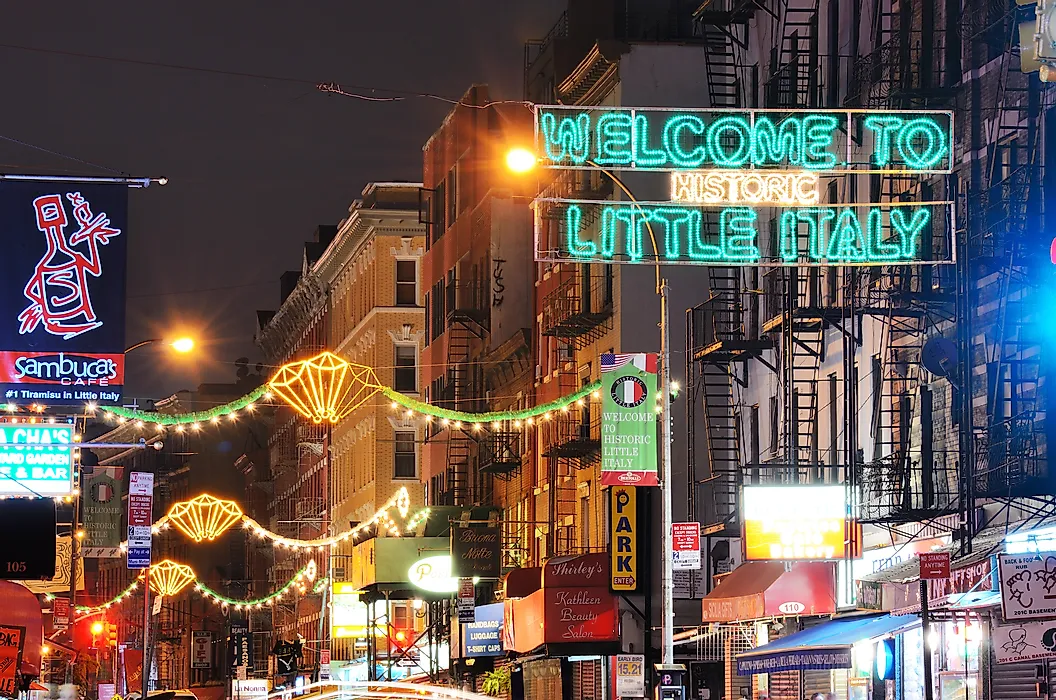
Figure 2: Little Italy neighborhood in New York City (Pavone, 2021) Hispanics closing in on whites as New York City’s largest racial group
According to NY1, Hispanics grew by 6.6% - slightly lower than the city as a whole, but dwarfed by a massive increase in Asians, which exploded by a third since 2010 (Cuza, 2021).
What You Need To Know (Cuza, 2021)
- Approximately 2.49 million Hispanics live in the city, a 6.6% increase from 2010 (The 2020 Census)
- Currently, Hispanics make up 28.3% of the population, closing the gap with whites, who make up 30.9%
- The Hispanic population has declined in traditional enclaves like Washington Heights and Bushwick
In NYC, 28.3% of the population is Hispanic. While whites make up the largest share of the population, 30.9%, that gap has narrowed as Hispanics have continued to grow and whites have remained static (Cuza, 2021).
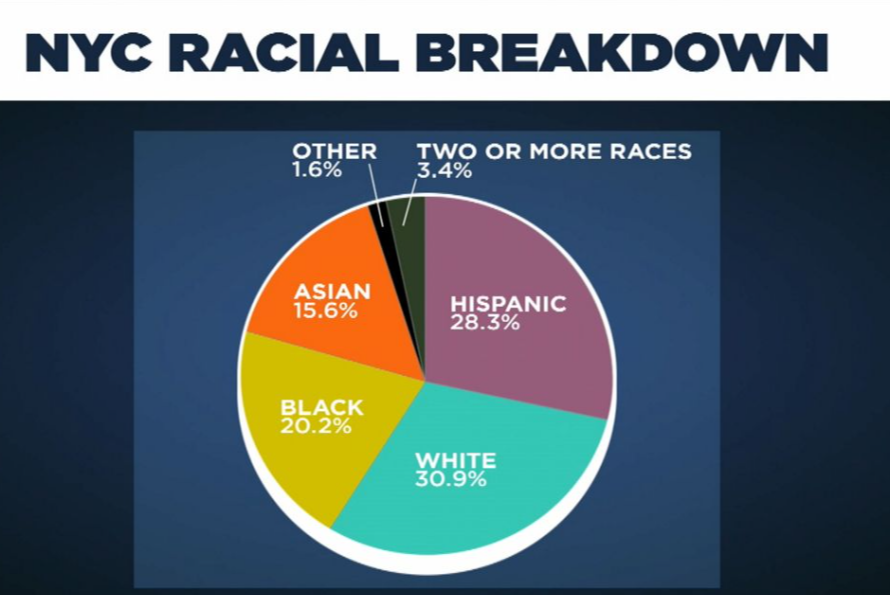
Figure 3: NYC Racial Breakdown in 2020 (NYC Department of City Planning, 2020) 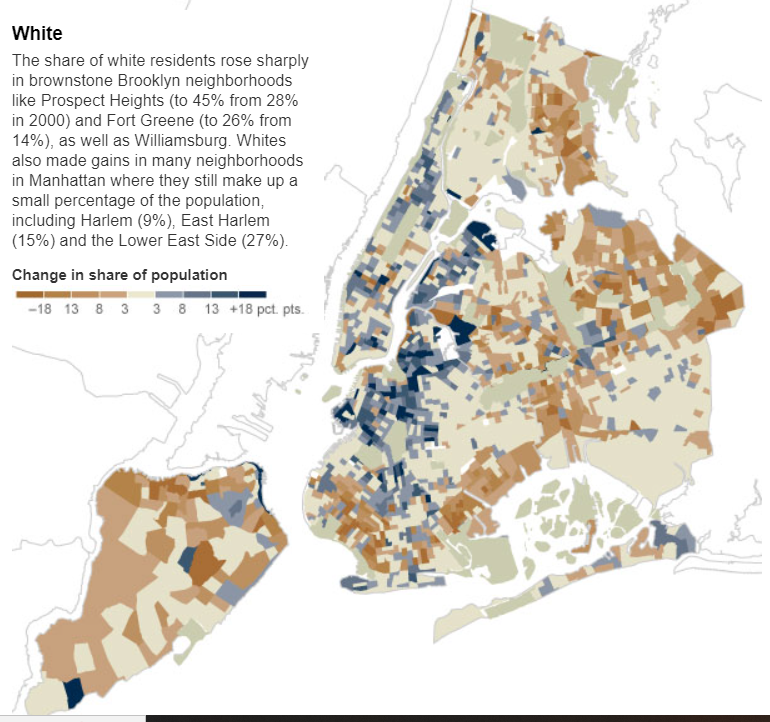
 0123
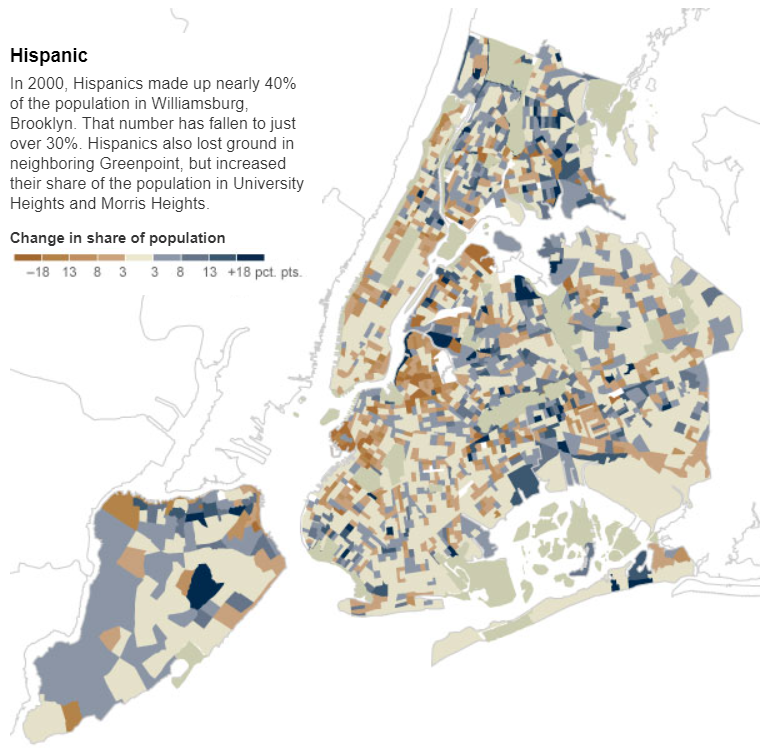
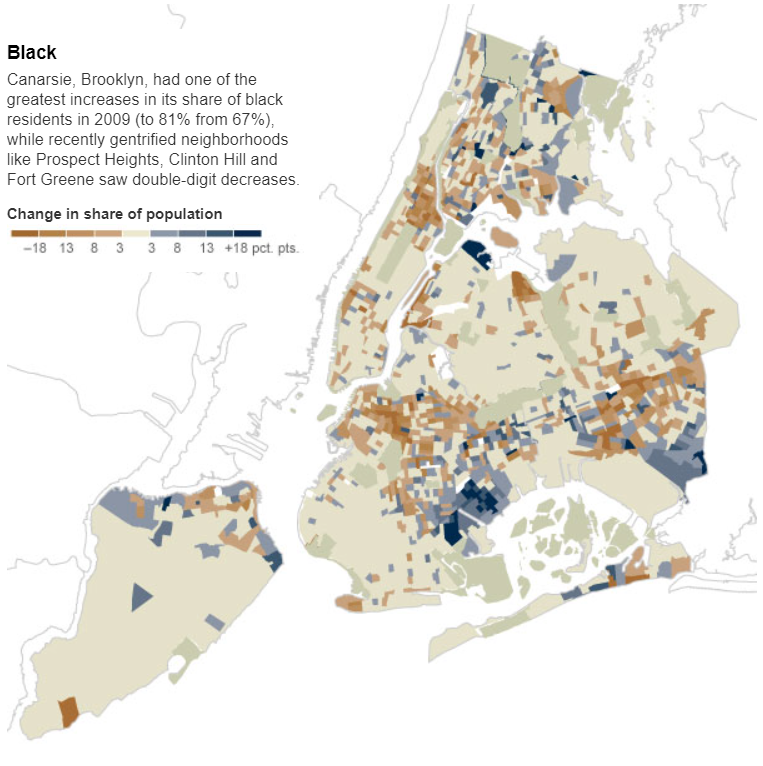
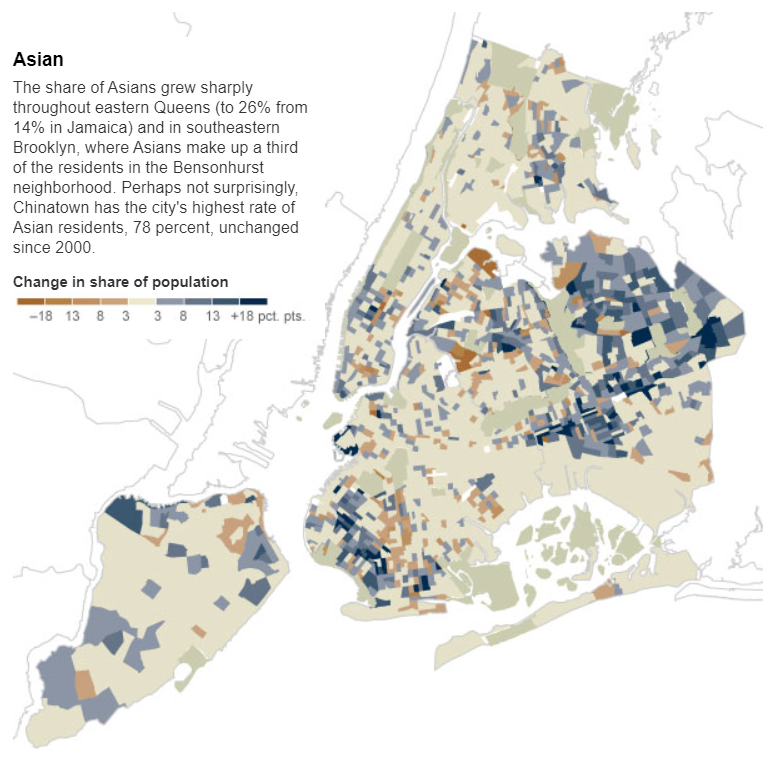
0123Figure 4: NYC Racial Makeup in 2000 (Beveridge, 2000) How about schools in New York City throughout?
NYC has one of the most segregated public schools that fail to reflect the pluralistic city’s hyper-diversity in terms of racial makeup. According to the NYC council statistics, 74 percent of Black and Hispanic students attend a school with less than 10 percent white students, while 34 percent of white students attend a school with more than half white peers. Moreover, racial segregation is closely interconnected with poverty. Since a public school often reflects neighborhoods’ socioeconomic status (SES) and racial composition, the impact of school segregation on individual students is hard to disentangle from the issue of neighborhood poverty.
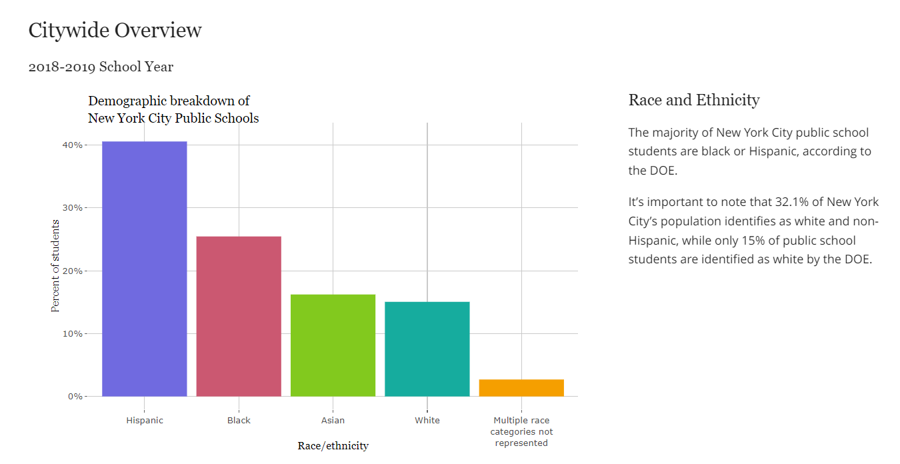
Figure 5-1: Demographic breakdown of New York City Public Schools (New York City Council, 2019) 
Figure 5-2: Percentage of students attending a school where more than 75% of students experience poverty (New York City Council, 2019) 

Figure 5-3: Segregated Schools in NYC (Yasmine Gateau for NPR, 2022) Social Context and Educational Inequality
According to Brown v. Board of Education of Topeka, which was decided by the U.S. Supreme Court in 1954, racial segregation in public schools is unconstitutional, regardless of their quality. As a result of the decision, the Court partially overruled Plessy v. Ferguson, which held that segregation laws did not violate the U.S. Constitution if the facilities for all races were of equal quality, a doctrine that became known as “separate but equal” (C. Vann, 1964). It was a major victory for the civil rights movement and a model for many future impact litigation cases as the Brown decision paved the way for integration.

Figure 6: Plessy vs Ferguson decision (The Constitutional Law Reporter, 2016) 
Figure 7: Discrimination between white and people of color in 1896 (Laura Temme, 2020) 
Figure 8: Discrimination between white and people of color in 1896 (Hla Oo's Blog, 2020) 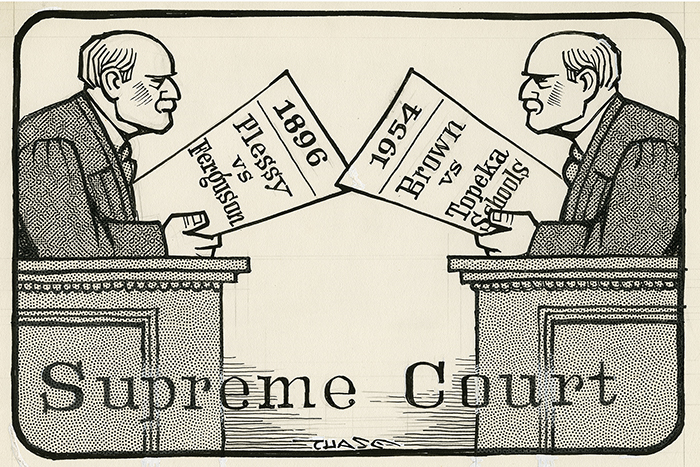
Figure 9: The Historic New Orleans Collection (Chase, 1977) 
Figure 10: Mother (Nettie Hunt) and daughter (Nickie) sit on steps of the Supreme Court building on May 18, 1954, the day following the Court's historic decision in Brown v. Board of Education. Nettie is holding a newspaper with the headline "High Court Bans Segregation in Public Schools." (Reproduction courtesy of Corbis Images) 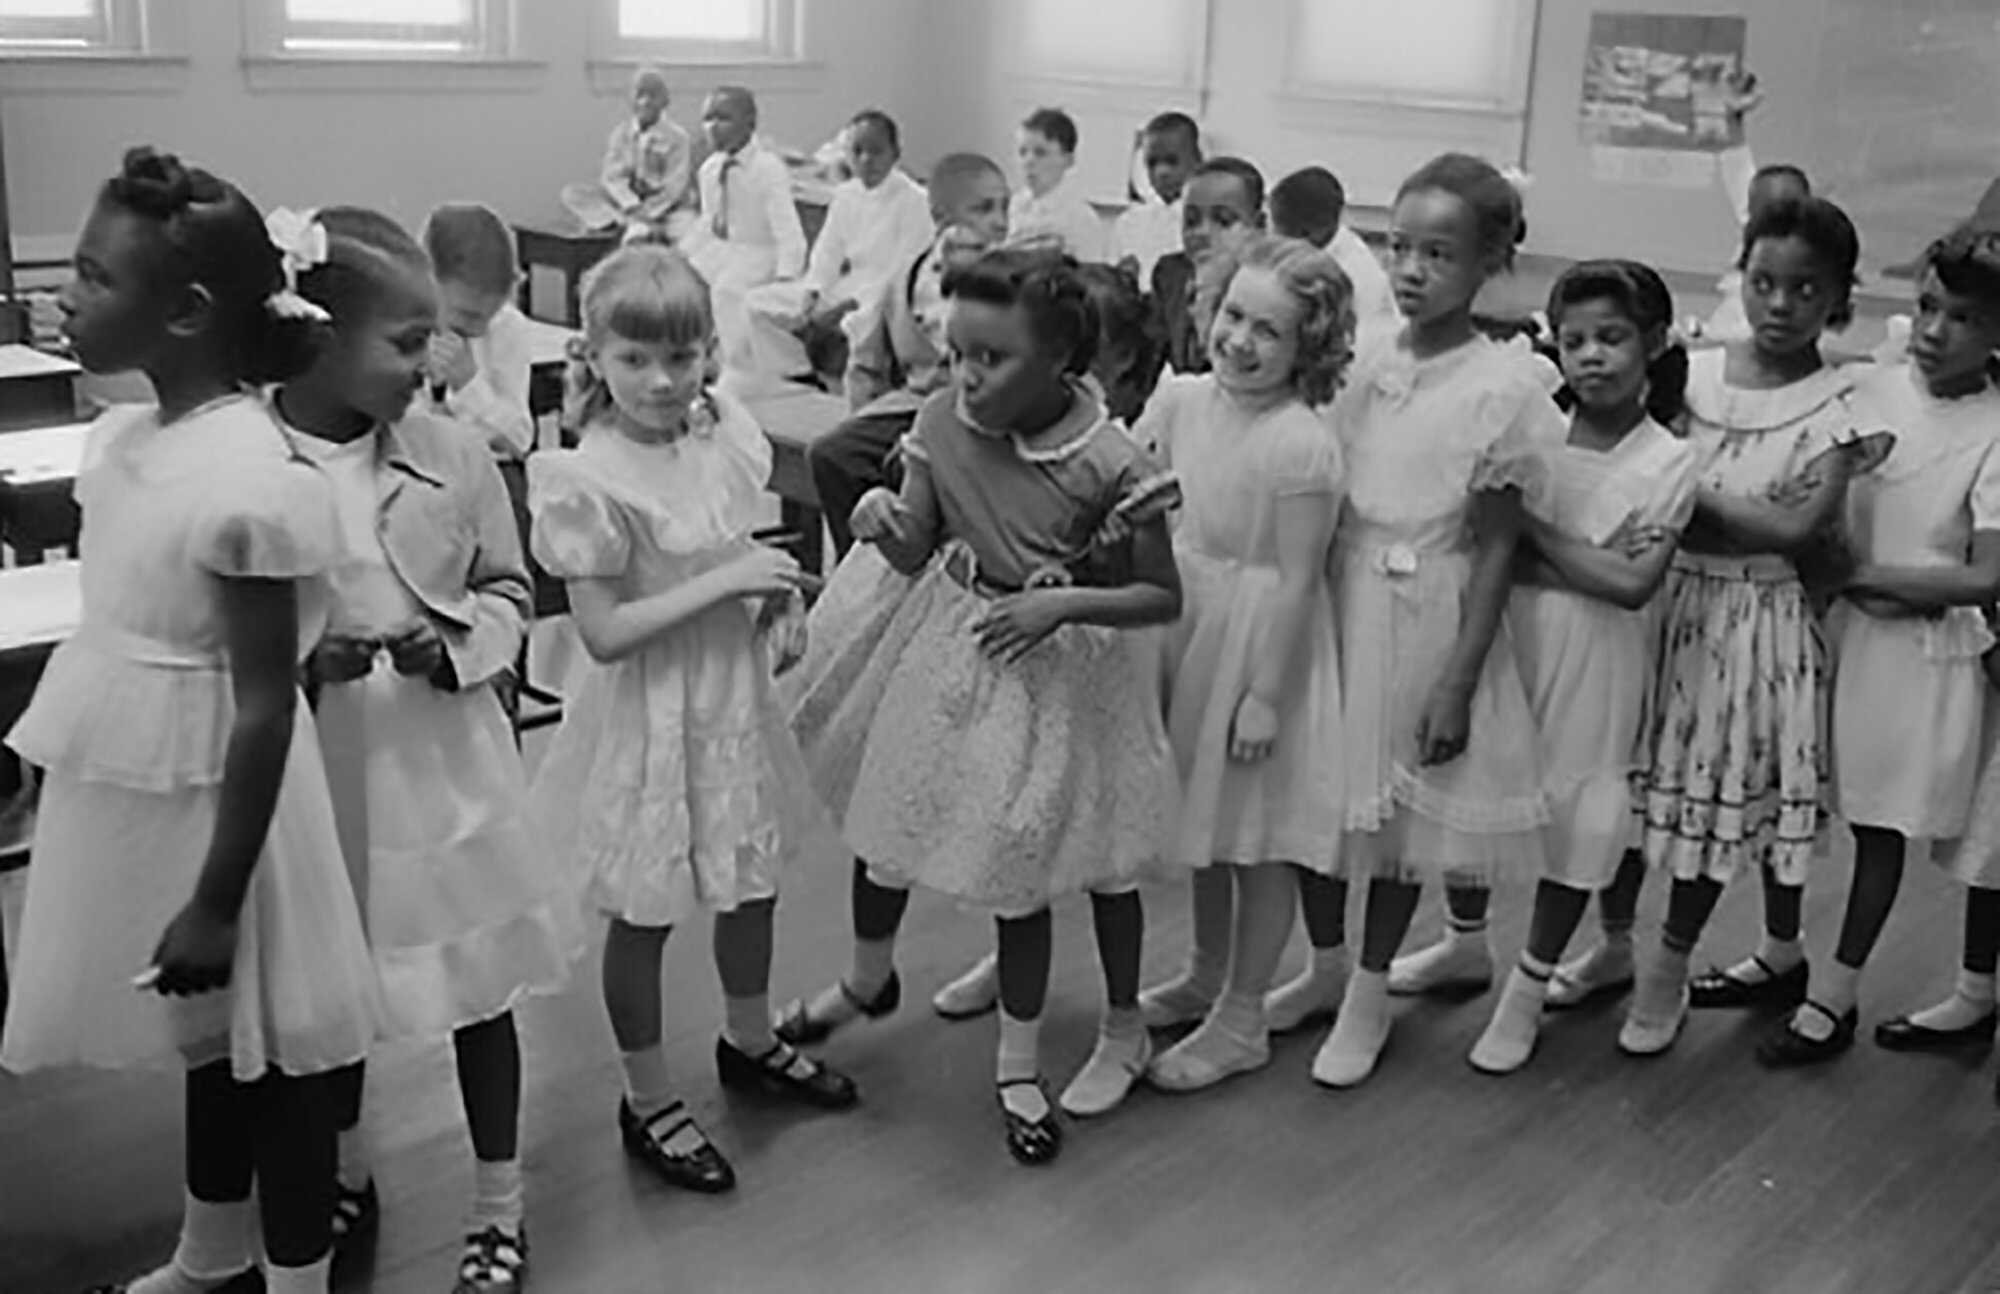
Figure 11: School Integration, Barnard School, Washington (Thomas, 1955)
During the decade after the Brown decision, school desegregation movements were raised across the nation. Among them, the Chicago Public Schools boycott was a mass boycott and demonstration against the segregationist policies of Superintendent Benjamin Willison October 22, 1963 (Washington Post, 2013). More than 200,000 students did not attend their schools, and at least 20,000 Chicagoans marched on the streets of Chicago (Dickson, 2022).

Figure 12: 225,000 Chicago Kids to Cut Class in 1963 'Freedom Day' (Erin, 2021) 
Figure 13: The 1963 Chicago Public Schools Boycott (Facing History&Ourselves, 2019) 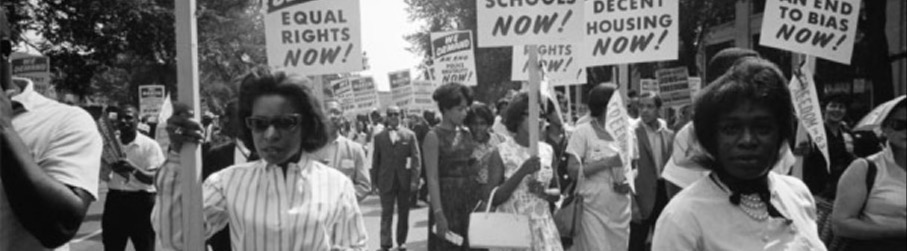
Figure 14: The 1963 Chicago Public Schools Boycott (Sutori, 2022)
After this massive demonstration against public school policies, the next biggest boycott took place in NYC. The NYC school boycott on February 3, 1964, referred to as Freedom Day, was one of the largest boycotts and demonstrations against segregation in the NYC public school system to show their support for racial integration in the city's public schools. Sanchez (2020) mentions that nearly half of all students and many teachers involved in the boycott demanding school integration and changes of the lamentable conditions at their public schools.

Figure 15: The NYC school boycott, referred to as Freedom Day in 1964 (Bettmann Archive/Getty Images) 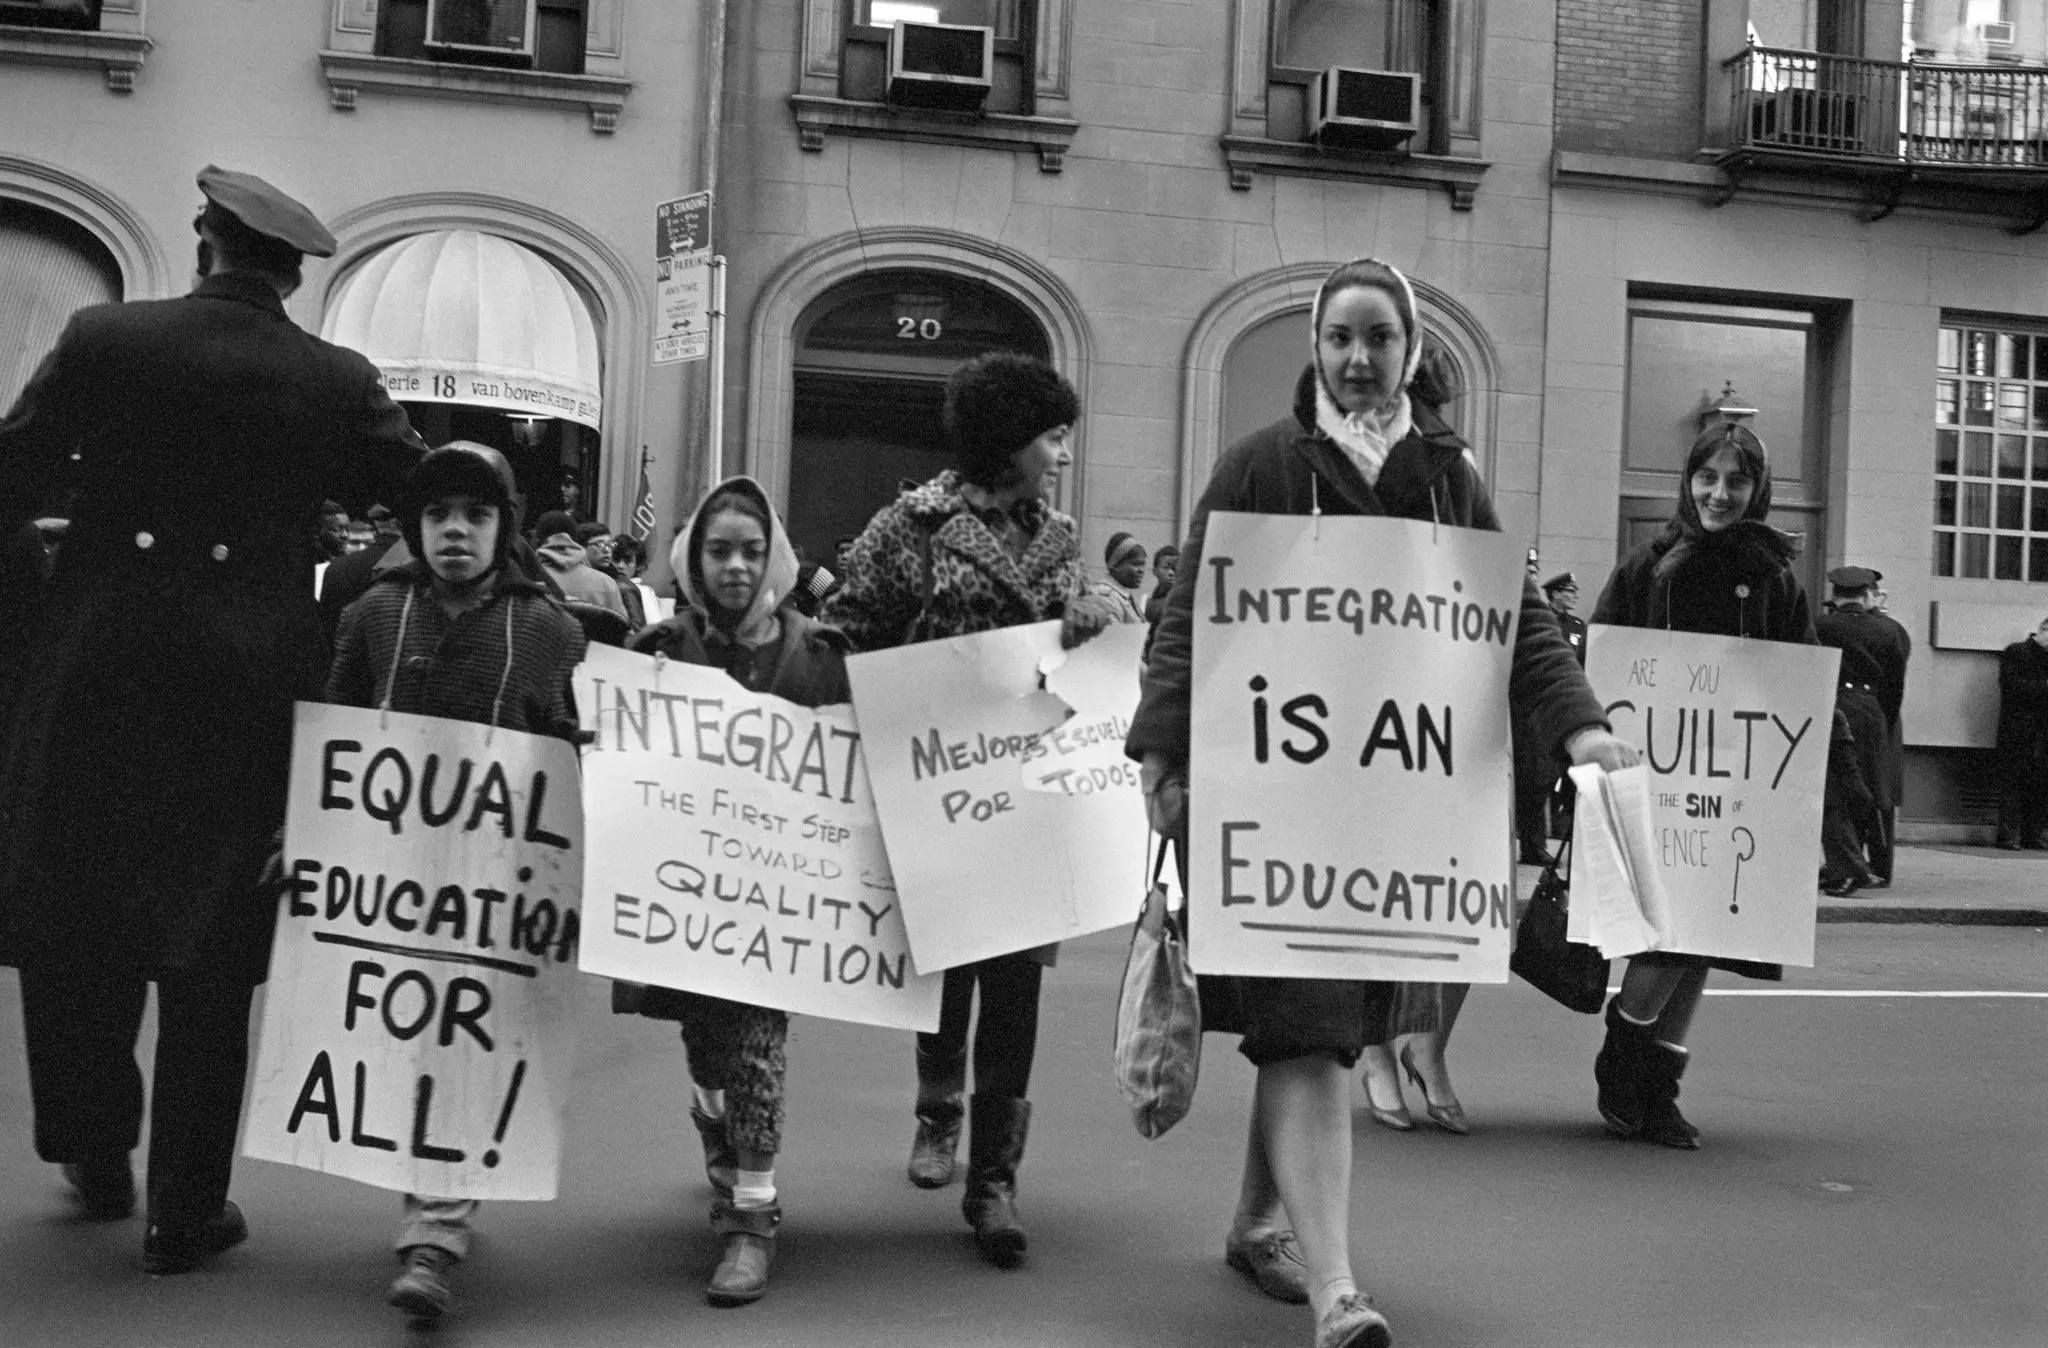
Figure 16: "Parents and students heading from Gov. Nelson Rockefeller office in Midtown to City Hall during a pro-integration boycott that kept over a third of the city, roughly one million students out of school. Feb. 3, 1964." (Days of Rage, 2020) 
Figure 17: The NYC school boycott, referred to as Freedom Day in 1964 (Bettmann Archive/Getty Images) 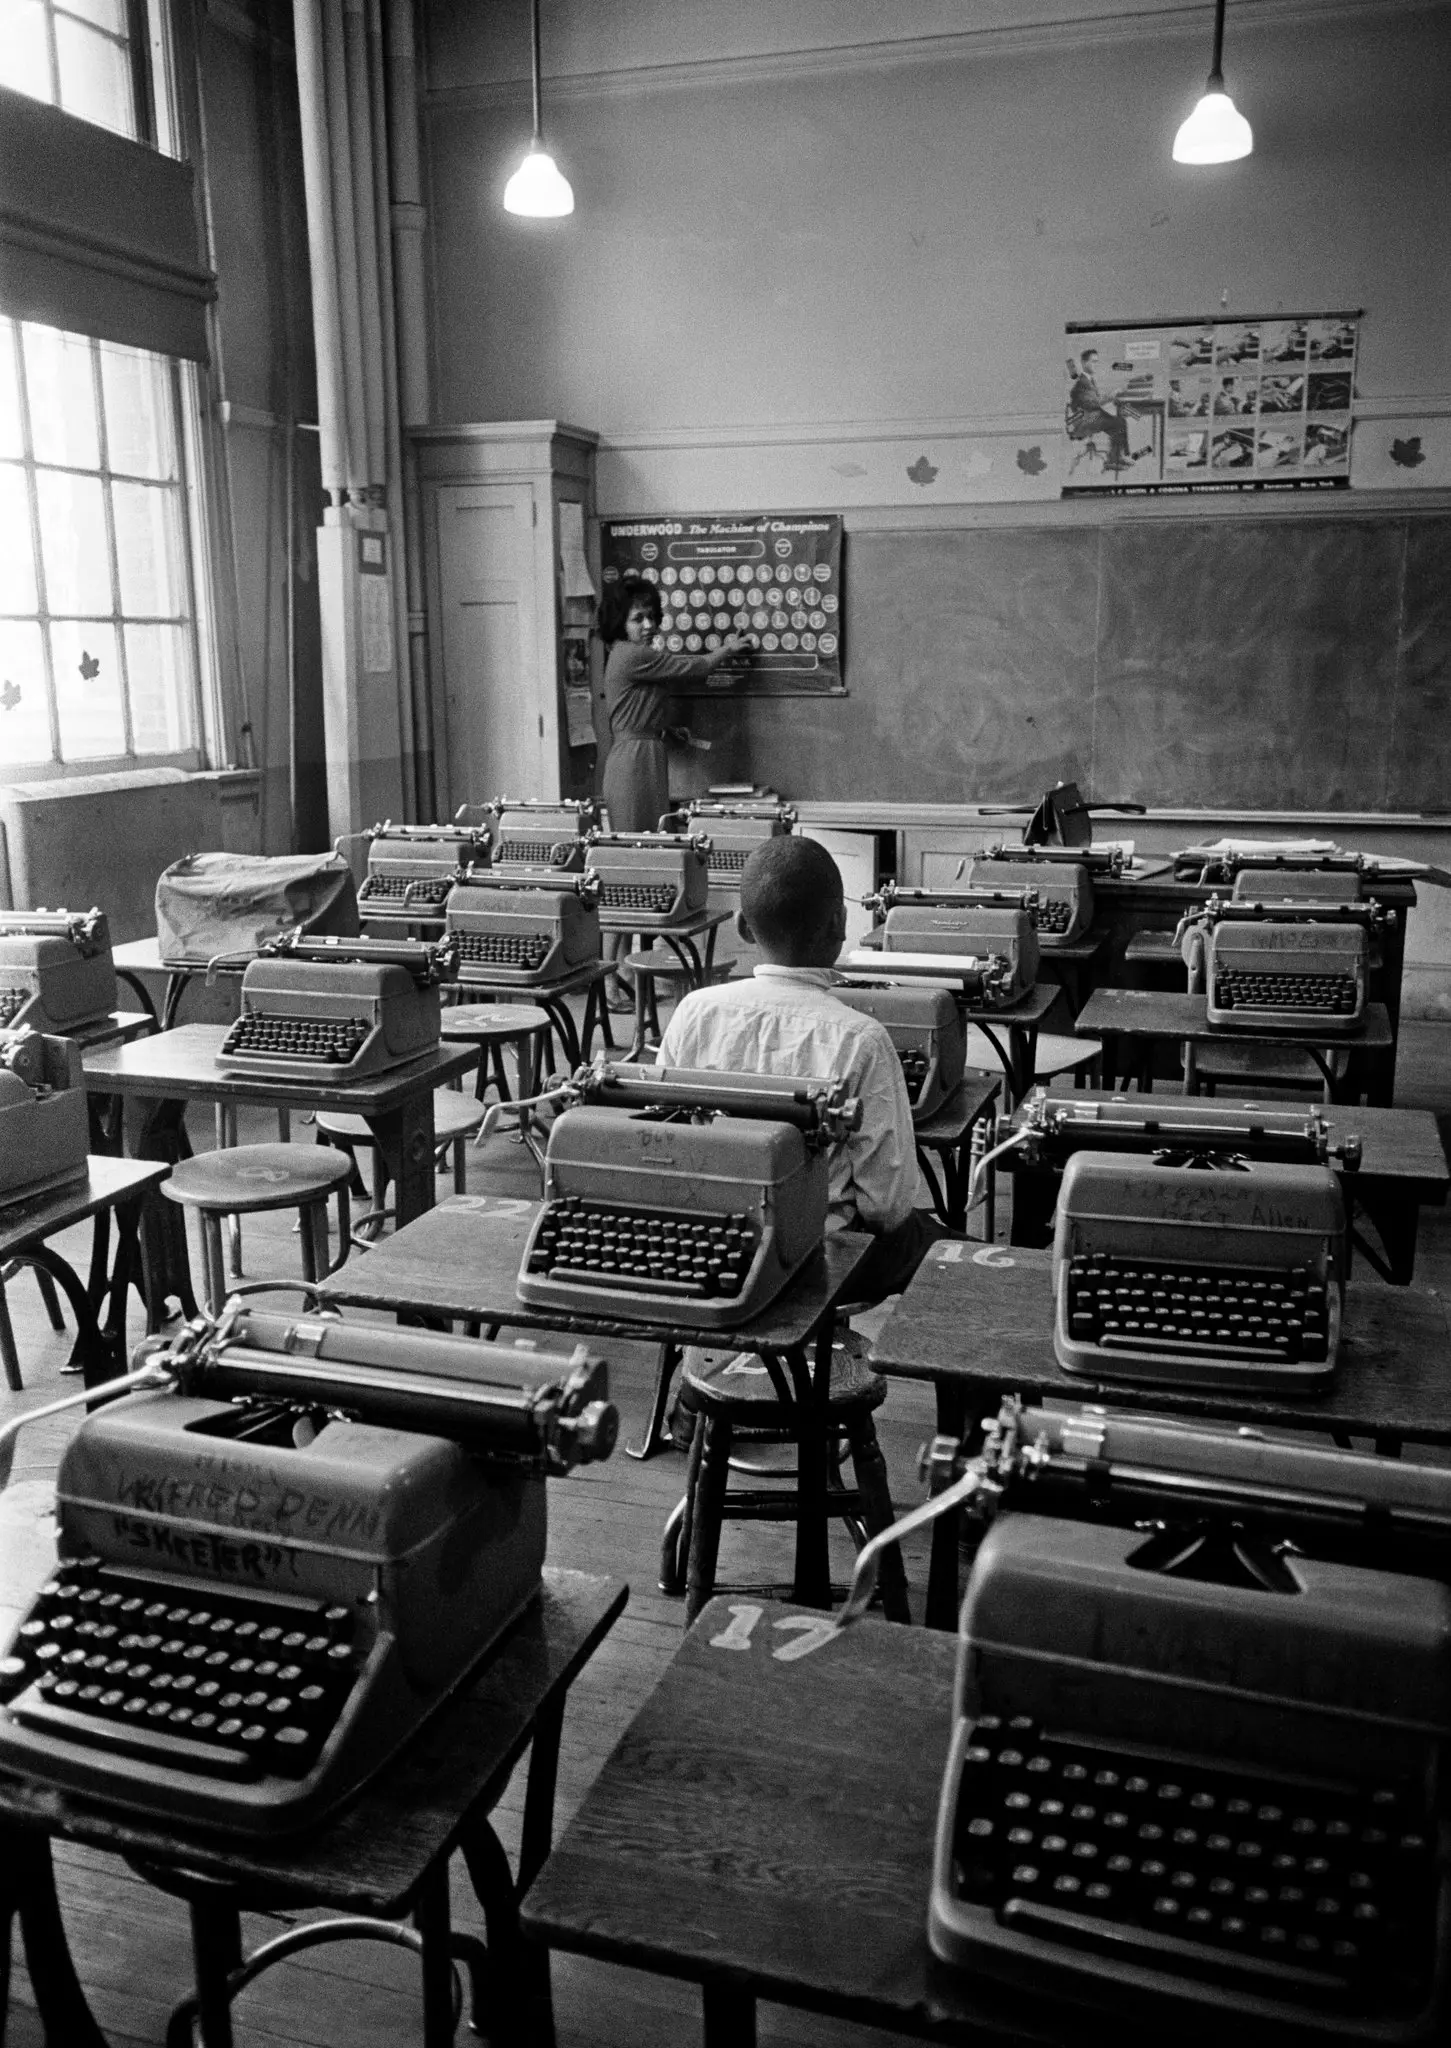
Figure 18: "A nearly empty typing class at P.S. 139 during another school boycott in favor of desegregation. March 16, 1964" (Eddie Hausner/The New York Times, 2019)
With this spirit of resistance against segregation in public schools, the Civil Rights Act was enacted on July 2, 1964. It prohibited racial segregation in schools and directed the Commissioner of Education to survey inequalities in educational opportunities for major racial, ethnic, and religious groups in the United States (Pfautz, 1967).

Figure 19: "The Civil Rights Act being enacted by President Lyndon Johnson, July 2, 1964. Civil rights legislation in the United States outlawed major forms of discrimination against racial, ethnic, national and religious minorities, and women." (Alamy Stock, 1964) 
Figure 20: "U.S. Pres. Lyndon B. Johnson turning to shake hands with civil rights leader Martin Luther King, Jr., on July 2, 1964, immediately after signing into law the Civil Rights Act" (AP images, 1964)
Educational elements affecting student achievement
There are some edcational elements that may affect students' academic performances. Based on the assumption that the level of school resources would have the potentially deleterious impact on the quality of communal services such as public education, the group of educational researchers looked into the relationship between the level of school resources invested and the achievement of students.

Figure 21: The level of school resources would have the potentially deleterious impact on the quality of communal services (ADDitude, 2019) Paco Martorell et al. (2016) claims that “little is known about the nature of school facility investments, whether it actually changes the physical condition of public schools, and the subsequent causal impacts on student achievement” (p.2). As they studied the achievement effects of nearly 1400 capital campaigns initiated and financed by local school districts, comparing districts where school capital bonds were either narrowly approved or defeated by district voters, they found only little evidence that these school capital campaigns improve student achievement. Moreover, event-study analysis focused on the students actually affected by large campus renovations also generates very precise zero estimates of achievement effects.

Figure 22: The importance of school rescourses (The Indian Express, 2022)
Rona Bušljeta (2013) emphasizes that diverse teaching and learning resources can change the results of students’ academic performances, claiming that “the purpose and role of teaching and learning resources do not only consist of making the educational process more attractive and interesting, but also of encouraging active learning, the development of different skills and the adoption of desirable values and attitudes in students” (p.55)

Figure 23: Diverse teaching and learning resources can change the results of students academic performances. (Dr. Mukesh, 2018)
Piopiunik et al. (2014) points out that teacher quality can create differences in students’ academic performances. As they implemented their research through new international data from the PIAAC survey of adult skills, they found a one-standard-deviation increase in subject-specific teacher skills raises student performance by 7 percent of a standard deviation in math and 6 percent in reading.

Figure 24: Teacher quality can create differences in students academic performances. (Long, 2021)
Coleman et al. (1966)’s ground-breaking research entitled “Study of Equality and Education Opportunity (EEO),” or the “Coleman report,” is widely recognized for revealing the determining factors on student’s achievement and shapes the sociology of education (Borman & Dowling, 2010). Their research indicates that schools with more white students performs better than ones with more Black students. This finding provides important insight into the relationship between school-level diversity and student performance, claiming that school-level diversity is not the most significant factor on students’ performance. Coleman and his colleagues find that a student's family background, coupled with various socioeconomic mix in the classroom, appear to be the biggest determinants of how well a child would learn (Gamoran et al. 2000). Also, the EEO study reveals that the peer network outside of school reinforces students’ attitudes toward education which emphasize the importance of cultural and family background than the school as a social organization. Also, Jencks et al. (1990) poses that the school-level diversity and resources have no significant effect on student’s educational performance. They claim that children from affluent families do better than children from poor families no matter where they live. Such a rationale has negatively impacted the policy regarding school desegregation due to the unintended outcomes such as low relationship between school-related-factors (e.g., budget, racial diversity) and student performance vis-à-vis individual attribution of student.
Figure 25: Reconsidering The Coleman Report On Its 50th Anniversary in Washington, D.C. (The Thomas B. Fordham Institute, 2020)
However, not every scholar has accepted these conclusions. Among them, there is a group of researchers arguing that “long-term benefits exist for students of all races in terms of collegiate attendance, interracial relationships, business networking, attitudes toward other races, and overall social development” (Clayton 2011, p.672).

Figure 26: Long-term benefits exist for students of all races in terms of interracial relationships, attitudes toward other races. (Rachel Moss, 2020) 
Figure 27: long-term benefits exist for students of all races in terms of collegiate attendance, business networking and overall social development. (Wil Chan, 2022) According to The Century Foundation(2019) students in socioeconomically and racially diverse schools — regardless of a student’s own economic status — have stronger academic outcomes than students in schools with concentrated poverty.

Figure 28: Students in socioeconomically and racially diverse schools have stronger academic outcomes than students in schools with concentrated poverty. (NEA EDJustice, 2017)
On the 2011 National Assessment of Educational Progress (NAEP) given to fourth graders in math, for example, low-income students attending more affluent schools scored roughly two years of learning ahead of low-income students in high-poverty schools.
Figure 29: low-income students attending more affluent schools scored roughly two years of learning ahead of low-income students in high-poverty schools. (Time4Learning, 2022) Also, Palardy (2013) argues that students in integrated schools are more likely to enroll in college. Page (2008) claims that integrated classrooms encourage critical thinking, problem solving, and creativity because students learning cooperatively alongside those whose perspectives and backgrounds are different from their own can acquire problem-solving skills.

Figure 30: Integrated classrooms encourage critical thinking, problem solving, and creativity. (Nick Shepherd/Getty Images, 2020)
School Segregation, Desegregation, and Integration
Other scholars studied the changing racial and ethnic landscape of public schools. Since the historical court decision Brown v. Board of Education of Topeka, Kansas of 1954 laid the foundation of racial integration in schools, the U.S. school communities has been experiencing dramatic increases of ethnic and racial diversity. According to Orfield and Frankenberg (2014), between 1989 and 2011, the public school enrollment percent of white students in the United States significantly dropped by -16.3%, followed by black students (-0.8%) while the percent of Asian students(2.3%) and especially Latino students (12.8%) increased by larger margins. The overall racial composition of the U.S. public school in 2011 was 51% white, the biggest group, followed by Latinos (24%), Black (16%) and Asian (5%) which reflects the transformed racial composition of US society due to the 1965 Immigration Act.

Figure 31: The changing racial and ethnic landscape of public schools-The U.S. school communities has been experiencing dramatic increases of ethnic and racial diversity. (The U.S. Department of Labor, 2016) Some scholars studied the effect of segregation on educational attainment by delving into the multiple dimensions of racial context of the school. According to Frankenberg (2007), evolving legal decisions on the case of racial segregation after the 1954 Brown v. Board of Education decision suggest that the definition of segregation and desegregation (or integration), and the trend of resegregation have been changing based on the overall racial composition of society. For example, “in 1968 Green v School Board of New Kent County decision, the Court defined six separate indicators of desegregation such as facilities, staff, faculty, extracurricular activities, transportation, and student assignments” (Frankenberg 2007, p.538).
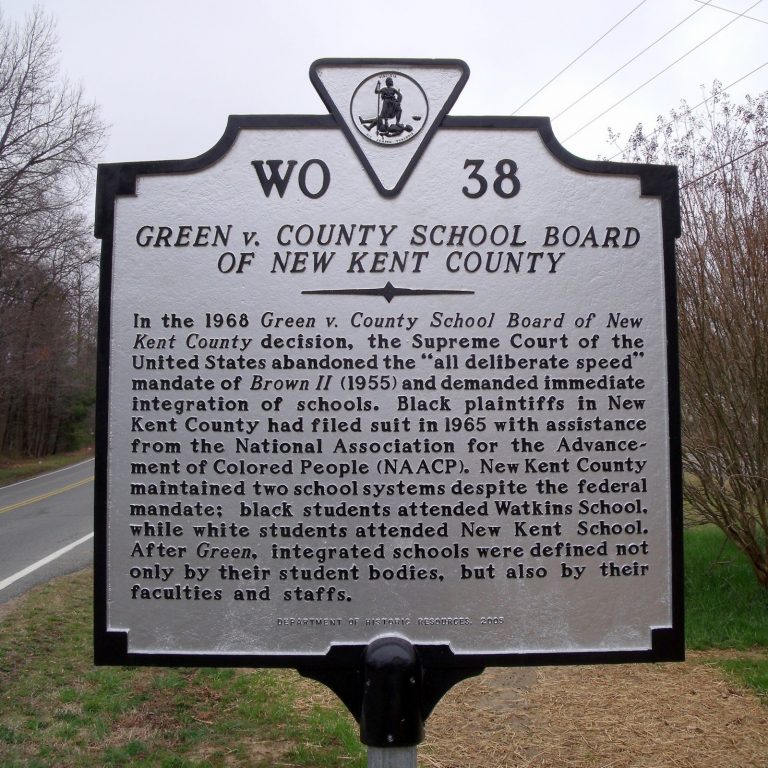
Figure 32: 1968 Green v School Board of New Kent County decision (Bernard Fisher, 2009) Current Trend on School Segregation and Integration Efforts in NYC
Eliza Shapiro(2019) claims that while NYC has changed significantly since 50 years ago, one aspect has barely changed: Its public schools remain highly segregated. According to her claim, only seven black students were offered admission to Stuyvesant High School's freshman class in 2019, which demonstrates that NYC schools remain segregated.

Figure 33: Students at Stuyvesant High School, where only seven black applicants gained admission in 2019. (Christopher Lee, 2019) As a former mayor De Blasio ruled out using busing to achieve integration in 2018, attempts to integrate middle-class neighborhoods have sparked fierce opposition from mostly white parents, who object to their children attending schools even a few city blocks from where they live.
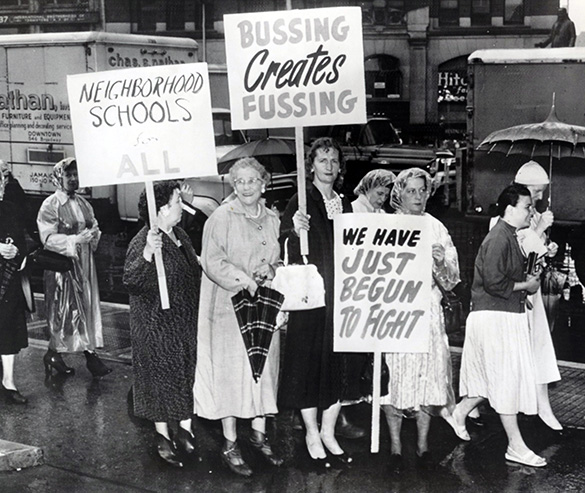
Figure 34: "White parents from Queens (NY) protest the proposed transfer of four hundred black and Puerto Rican students from the Bedford-Stuyvesant section of Brooklyn. This was a one-way plan that would not have transferred any white students." (Associated Press photo, June 25, 1959) 
Figure 35: Archival photo from national protests during the integration of Catholic schools in 1962 (Associated Press, 1962) In 2016, a plan to send some Upper West Side children to a lower-performing, mostly black and Hispanic students, low-income school about ten minutes walk away was met with anger (Shapiro, 2019). David R. Jones (2018) argues that he sees “a clear dynamic of opportunity hoarding, whereby groups of (largely white) parents with resources utilize existing mechanisms like school choice and specialized programming to create segregated environments for their children” (para. 2). He points out that for their own purposes, white parents can turn public schools into private schools. Particularly, gated communities, which are forms of residential community or housing estate containing strictly controlled entrances for pedestrians, bicycles, and automobiles, and often characterized by a closed perimeter of walls and fences, are bad enough to create school segregation. He claims that there are a range of benefits students who attend schools near gated communities enjoy, including better resources, more active parents, and other benefits that are hard to quantify, but are evident in their test scores.

Figure 36: David R. Jones argues that he sees a clear dynamic of opportunity hoarding particularly in gated communities. (Condo, 2022) Poverty and Student Achievement
Why then does school segregation matter in educational attainment? To answer this question, we need to look into the poverty dimension entrenched in the school segregation. Orfield and Lee (2004) aptly summarize the multi-dimensional aspects of segregation: “segregation by race is systemically linked to other forms of segregation, including segregation by socioeconomic status, by residential location, and increasingly by language” (p.14). This statement articulates how school segregation not only reflects but also reinforces the racial stratification in society. Similarly, Rumberger and Palardy’s (2005) research on the relationship between Social Economic Status (SES) of a school and student achievement reveals that school level SES has more significant impact than racial diversity on performance. As students are required by their governments to attend neighborhood schools rather than far but desirable schools by busing, the chance of a minority student from a poor neighborhood to go to school with unfavorable conditions in terms of investment, resources, peer culture, teacher expectation, etc., is much higher than middle class white students. As Clayton (2011) aptly summarizes, “minority students face the triple challenges characterized by individual poverty, school-level poverty, and school-level segregation” (p.676). In terms of the effect of SES on student performance, it is not easy to separate the effect of school-level poverty from other conditions such as classroom experience, teacher’s quality and expectation. As Borman and Dowling (2010) describe, school-level effects are “mediated by processes occurring at multiple levels of school system organization” (p.1204). To identify schooling effects apart from various mediating factors, many scholars use the nested layers approach, which means a way of analysis of diverse variables' educational impact at the regional, federal and national level (Bidwell and Kasarda 1980).

Figure 37: People line up for food at Holy Trinity English Lutheran Church in Minneapolis on June 5, 2020. (Kerem Yuce/Getty Images) Background of Research
This research is predicated on the assumption that NYC school-level poverty and racial segregation will affect student performance. The NYC Department of Education (DOE) aims that “all students benefit from diverse and inclusive schools and classrooms (… in line with) our vision of Equity and Excellence for all NYC students.” Such a statement is specified with three aspects related to school quality: racial diversity, economic stratification (or poverty), and inclusiveness in relation to English language learners (ELL) and student with disabilities. According to the statistics of the NYC DOE, about 30% of NYC schools are Racially Representative (RR) schools. That means that the percent of combined Hispanic and Black children maintains between 50% and 90%, given the ratio (70%) of entire students from these two racial groups citywide (Hill et al., 2020). They set the goal to increase the number of students in RR schools up to 50,000 by 2024 (NYC DOE 2017, p.4).

Figure 38: Racially Representative Elementary and Middle Schools in 2017-2018, Based on Proportion of Black and Latino Students (The Research Alliance for New York City Schools, 2020) The five Community School District(CSD)s with the highest proportions of racially representative schools are CSD 1 (58 percent), which includes the Lower East Side and Chinatown in Manhattan; CSD 13 (48 percent), which includes Brooklyn Heights and Fort Greene in Brooklyn; CSDs 24 (51 percent) and 30 (52 percent), which include the Ridgewood and Elmhurst, Astoria, and Jackson Heights neighborhoods in Queens; and CSD 11 (48 percent), which includes the Pelham Parkway and Woodlawn neighborhoods in the Northeastern Bronx. A distinguishing feature of these CSDs is that they enroll a sufficiently high proportion of white and/or Asian students to limit the concentration of Black and Latino students in any one school. In contrast, there are few racially representative schools in CSDs such as 7, 9, and 10 in the Bronx, where the student population is largely Black or Latino (Hill, 2020).
In terms of school-level poverty, NYC developed the Economic Need Index (ENI) for the schools to determine the level of economic stratifications. The index is calculated based on several factors, including the percentage of families in the census tract with school-age-children which fall under poverty line, live in temporary housing, and are eligible for free lunch, which are estimated by the American Community Survey (ACS) 5-Year Estimate. NYC defines the economically stratified school if its ENI is more than 10% higher than citywide average. According to the statistics, about 70% of NYC schools are economically stratified (NYC DOE 2017. p.4).

Figure 39: NYC developed the Economic Need Index (ENI) for the schools to determine the level of economic stratifications. (UACD, 2022) NYC has been endeavoring to integrate public schools through various measures. For instance, NYC aims to increase the number of Racial Representative schools across the 32 CSDs toward the direction of reflecting racial makeup of the neighborhoods. Also, former mayor Bill de Blasio called on the city to evaluate public schools not only based on students’ academic achievement, but also on the racial diversity rate from 2019.

Figure 40: "Former Mayor Bill de Blasio, flanked by former New York City Schools Chancellor Richard Carranza, right, delivers remarks about a diversity plan in Brooklyn." (Dave Sanders for The New York Times, 2019) However, NYC still falls behind in terms of desegregation and integration of public schools. NYC test results showed wide academic gaps for Hispanic and black students: the math exam pass rate of white students and Asian students was 67% and 74% respectively, while only 28% for Black students in 2019 (Shapiro, 2019). Disparities still remained between white and Asian American students compared with their Black and Latino peers in 2022. About 70.5% of Asian American and 67% of white students passed reading exams, compared with 35.8% of students who are Black and 36.8% who are Latino (Amin, 2022). For math, 68.3% of Asian American students and 58.5% of white students passed compared with 20.6% of Black children and 23.3% of Latino students. According to the DOE of NYC, Students across all demographic subgroups experienced a drop in math proficiency in 2022, when compared to 2019.The largest drop in math proficiency was among Hispanic students, who scored 9.9 percentage points lower in 2022 (23.3%) than in 2019 (33.2%) (Knudson, 2022). Also, the ratio of students attending a school with high poverty-concentration shows big discrepancies between white and minority students. According to the NYC council statistics in 2020, 74 percent of Black and Hispanic students attend a school with less than 10 percent white students, while 34 percent of white students attend a school with more than half white peers. And more than 60 percent of Hispanic and Black students are attending schools where more than 75 percent of peer students experience poverty compared to their white counterpart around 20 percent. Such racial and poverty dimensions of NYC public schools represent that school segregation is strongly interconnected with the issues of race and students’ academic performance.

Figure 41: NYC test results showed wide academic gaps for Hispanic and Black students. (Annalise, 2022) 
Figure 42: "Former Mayor Bill de Blasio has reduced the weight of standardized exams in decisions about New York City schools, teachers and students." (James Estrin, 2019)
Methods
Research Design
This study uses various methods such as correlational analysis, regression and t-test to determine the relationships and predictability of racial composition and poverty on students’ performance in NYC public schools. Quantitative methods include the reporting and analysis of descriptive statistics. The multiple regression analysis used school-level performance as the dependent variable and racial diversity and economic need index, which is an indicator of school-level poverty, as the independent variables. A t-test was employed to measure the effect of segregation and racial representation on performance respectively.
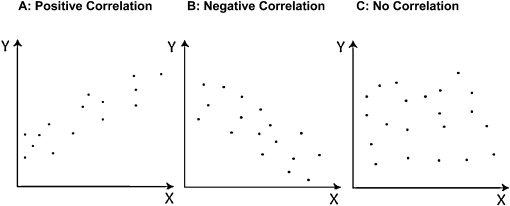
Figure 43: Types of Correlation Sample
Data for this study was collected by the NYC DOE. NYC open data provides 2017-2018 quality data report for elementary, middle, and K-8 schools online. Private schools and public high schools are not included in the dataset. With this dataset, I obtained statistical information of racial composition and economic need index of entire schools in 32 NYC school districts. In addition to that, I used the 2017 ‘school quality review’ dataset released by NYC DOE, which includes school-level performance, the dependent variable. In total there were 1,213 schools in the cleaned dataset. I created a separate district level dataset to compare variables across 32 NYC community school districts.
Figure 44: NYC Open Data Homepage Variables
School-level performance is the dependent variable. Annual school performance is measured by combining multiple student achievement outcomes such as math and English scores in state exams, although there was no available information on the exact equation or calculation of the performance indicator. A higher performance index (close to 1) indicates higher achievement of the student at the school-level. The analysis includes racial compositions and economic status as independent variables.
I created three different measurements for racial composition to see the various aspect of racial diversity in NYC schools.
First, each school’s “Racial Diversity” was calculated based on the number of students from different racial groups using the Simpson’s Diversity Index. As a continuous variable, a high score (close to 1) indicates high racial diversity, while a low score (close to 0) indicates low racial diversity.
Second, “Segregation Level” was calculated based on the criteria of the NYC DOE segregation definition. A school is considered highly segregated if it includes less than 10 percent of white student regardless of other racial composition. I coded the ‘Segregation’ variable as binary (highly segregated vs. moderately segregated) one.
Third, based on the definition of the “Racial Representation Index,” a categorical variable reflecting racial makeup of the NYC, a school with percent of Hispanic and Black students spans between 50 and 90 was coded as “medium” RR, while less than 50 was coded as “low”, and more than “90” was coded as high.
The Economic Need Index (ENI), a continuous variable ranging between 0 and 1, was used as it was provided in the school quality review dataset. The index is calculated based on the percent of students in families eligible for Health Reimbursement Arrangement (HRA) assistance and below the federal poverty level, combined with the percent of students in temporary housing during the past four years. Thus, the ENI may reflect the level of poverty of students at the school level. Higher ENI (close to 1) indicates a higher level of poverty concentration in the school. In addition, I included the ENI as a dependent variable in the T-test and ANOVA to look at the relationship between schools with different racial compositions and poverty.
Result
Descriptive Statistics
Racial and Economic Composition of NYC Public Schools and Community School Districts
To examine the racial diversity and economic status of NYC schools, I first combined 32 school districts into a single dataset. Figure 45 shows the representation of diversity, the ENI, and performance by each district level. The map of the ENI and the map of performance show a somewhat inversely related color distribution. It means that a district with a lower average of ENI is more likely to perform better. District 2 (mid-lower Manhattan), District 15 (Brooklyn), District 20 (Brooklyn), District 25 (Flushing), and District 26 (Bayside) are the top-five districts above 0.5 performance index.
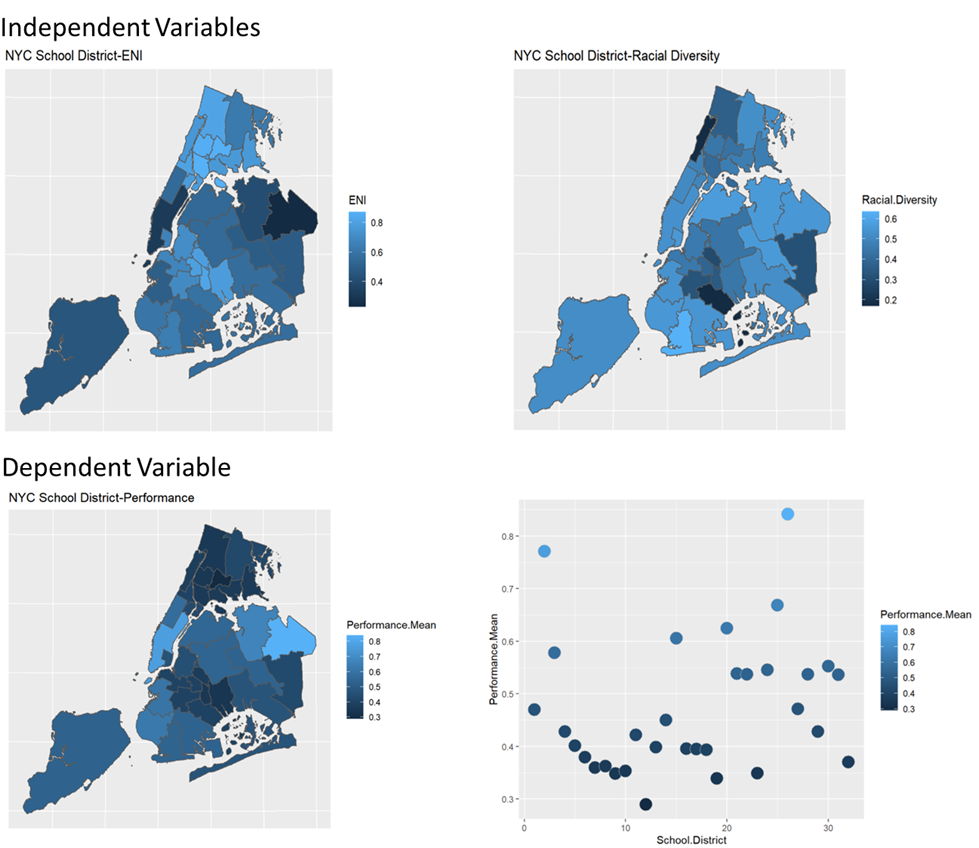
Figure 45:; Variables Characteristics across 32 NYC School Districts Table 1 represents the overall racial composition of NYC schools and the means of each variable, respectively. In terms of overall racial composition, NYC schools have similar proportions among white (12%) and Asian (12%) students, while Hispanic students account for the majority (41%), followed by Black students (31%).

Table 1: Descriptive Statistics of Variables (racial compositions/performance/racial diversity/ENI means, 2017-2018) Table 2 describes segregation and racial representation levels: about 68% of NYC schools are classified as “intensely segregated,” according to the criteria of less than 10% white student inclusion. In terms of racial representation, about 24% NYC schools have the Black and Hispanic student ratio somewhere between 50-90 % of total enrollment. More than two-thirds of NYC schools have a highly segregated racial composition with more than 90% of Hispanic and Black students combined, given that the entire proportion of two racial groups were above 72%.

Table 2. Percent of NYC Schools by Level of Segregation and Racial Representation(2017-2018) Correlations
The correlation analyses results indicate that there is a significant relationship between the racial compositions, poverty and performance at the school level. Table 3 indicates that the proportion of each racial group has different, but all statistically significant relationships, with student achievement. First, the percent of whites and Asians have a positive correlation with performance while the Black students and Hispanic students have a negative relationship.

Table3. Correlations between % race and performance In Table 4 and 5, we can find the positive correlation between the racial diversity and performance (correlation = 0.25), whereas the ENI is negatively correlated with the performance score (correlation = -0.78).

Table 4: Correlation-Performance by Racial Diversity 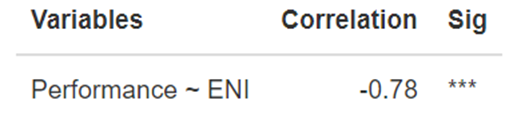
Table 5: Correlation-Performance by Poverty This is further highlighted in Figure 46 and Figure 47 by the flat linear fit line associated with the variation in performance related to the variation in the racial diversity index and the ENI respectively. The results suggest that the schools with higher racial diversity (i.e., more evenly distributed racial compositions) and with lower poverty concentration demonstrate higher student achievement in general. Among the variables, the strongest correlations were the ENI (-0.78) and the percent of white (0.61). It seems that the effects of two variables (poverty and racial diversity) on performance are somewhat entangled and hard to separate since the highly diverse school also demonstrated the higher ENI score.

Figure 46. Correlations between racial diversity, economic need index (ENI), and performance 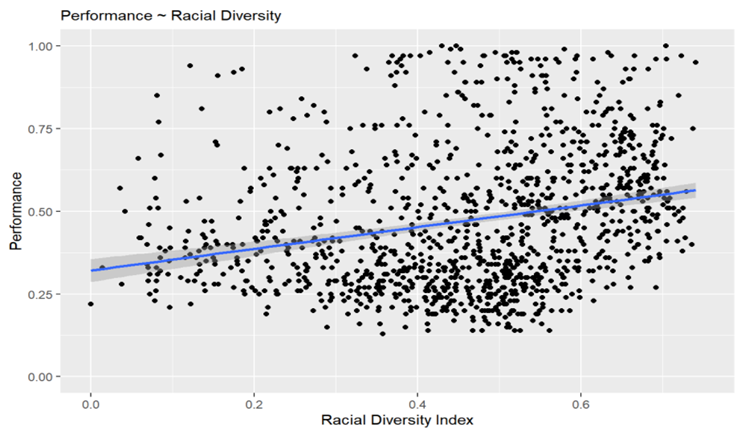
Figure 47. Correlation: Performance by Racial Diversity 
Figure 48: Correlation-Performance by Poverty Multiple Regression Analysis
To examine the predictability of relationship between the independent variables (ENI and racial diversity) and school-level performance, multiple regression analysis was conducted. The hypothesis for analysis is as following: “Do School level poverty and racial diversity predict academic performance?”
The final set of result in Table 6 indicates that the relationships between performance and the ENI and racial diversity are statistically significant because the p-values are less than the significance level of 0.05. The model explains 60.7% (r-square=0.607) of the variation indicating that the model provides a good fit to the data. The result indicates that one unit increase in the observed ENI score is associated with a decrease in the observed performance of 0.735. Also, one unit increase in the observed racial diversity is associated with an increase in the observed performance score of 0.049 scores when all other variables remain constant. The regression result suggests that a school with the lower ENI and higher racial diversity is more likely to have a higher academic performance.

Table 6: Result for Multiple Regression Analysis
Discussion and Implications
Overall, the findings indicate that there are significant relationships between the racial composition, segregation, poverty concentration, and school-level performance. Even though the study confirms widespread perceptions on the relationship between race, poverty and academic achievement, there are many other factors that could have an impact on student’s performance unexamined in this research. For instance, presumable determinants include the effect of teacher quality and expectation, school leadership effectiveness, school budget and parents’ SES. Also, due to the availability and accessibility of dataset, poverty and performance were measured at the school level rather than individual level in this research. Therefore, it was not possible to identify the precise impact of the school-level segregation on the individual student’s academic achievement.
Nevertheless, this empirical study on NYC public schools provides several implications not only for policies but also for future research. First, there is a strong correlation between poverty and school level performance. In this study, the poverty index (ENI) was measured as a combined score reflecting the percentage of students with free lunch eligibility, temporary housing and neighborhood poverty level. In future research, it is recommended to look at the separated impact of each factor related to economic status of child to evaluate the impact of current education policy which aims to reduce economic stratification of NYC public schools. Second, the percent of white students in school, which is also reflected in measuring the “segregation” variable, has the second strongest impact on school-level performance. In this study, however, it was not clear whether the increased ratio of white students has positive impact not only for the overall school level performance but also for all other racial students. To examine the effect of white student ratio in relation to the segregation problem, the future study needs to look at the relationship between the ratio of white students and individual achievement by different racial groups. This approach will provide enough legitimacy for currently reactivated desegregation and integration movement across the nation. Finally, the high racial representative school - Black students and Hispanic students accounting for more than 90 percent – shows the worst performance compared to the schools with low and medium level racial representations. Reversely, the study revealed that a school with more Black students and Hispanic students is more likely to be concentrated with poverty (measured by the ENI). This tendency suggests that the school desegregation policy needs to be implemented in tandem with community poverty reduction measures.
<References>
American Experience. (2017, November 21). Brown v. Board of Education: Topeka, 1954. American Experience. https://www.pbs.org/wgbh/americanexperience/features/eisenhower-brownvboard/
Amin, R. (2022, September 28). NYC test scores drop in math, increase in reading. Chalkbeat New York. https://ny.chalkbeat.org/2022/9/28/23377074/nyc-test-scores-math-reading-david-banks-pandemic
Borman, G., & Dowling, M. (2010). Schools and inequality: A multilevel analysis of Coleman’s equality of educational opportunity data. Teachers College Record, 112(5), 1201-1246.
Bušljeta, R. (2013). Effective use of teaching and learning resources. Czech-Polish Historical and Pedagogical Journal, 5(2).
Beveridge, A. A. (2010, December 14). How New York’s racial makeup has changed since 2000 - Map. NYTimes.Com. http://archive.nytimes.com/www.nytimes.com/interactive/2010/12/14/nyregion/census-graphic-ny.html?ref=nyregion
Blakemore, E. (2018, March 14). Why MLK encouraged 225,000 Chicago kids to cut class in 1963. HISTORY. https://www.history.com/news/chicago-public-school-boycott-1963-freedom-movement-mlk
Clayton, J. K. (2011). Changing diversity in US schools: The impact on elementary student performance and achievement. Education and Urban Society, 43(6), 671-695.
Coleman, J. S., Campbell, E. Q., Hobson, C. J., McPartland, J., Mood, A. M., Weinfeld, F. D., et al. (1966b). Supplemental appendix to the survey on equality of educational opportunity. Washington, DC: U.S. Government Printing Office.
Carrillo, S., & Salhotra, P. (2022, July 14). The U.S. student population is more diverse, but schools are still highly segregated. NPR. https://www.npr.org/2022/07/14/1111060299/school-segregation-report
Cuza, B. (2021, October 13). Hispanics closing in on whites as New York City’s largest racial group. Spectrum News NY1. https://www.ny1.com/nyc/all-boroughs/local-politics/2021/10/13/hispanics-closing-in-on-whites-as-new-york-city-s-largest-racial-group
C. Vann, Woodward. (1964, April). Plessy v. Ferguson. AMERICAN HERITAGE. https://www.americanheritage.com/plessy-v-ferguson
Long, C. (2021, November 8). What is Quality Teaching and How is It Supported? NEA. https://www.nea.org/advocating-for-change/new-from-nea/what-quality-teaching-and-how-it-supported
Dickson, R. (2013, October 22). 1963 Chicago public school boycott. WTTW News. https://news.wttw.com/2013/10/22/1963-chicago-public-school-boycott
Dodd, C. (2021, September 22). The world’s most multicultural cities. WorldAtlas. https://www.worldatlas.com/cities/the-world-s-most-multicultural-cities.html
Frankenberg, E. (2007). School segregation, desegregation, and integration: What do these terms mean in a post-Parents Involved in Community Schools, racially transitioning society. Seattle J. Soc. Just., 6, 533.
Gamoran, A., Secada, W. G., & Marrett, C. B. (2000). The organizational context of teaching and learning: Changing theoretical perspectives. In M. T. Hallinan (Ed.), Handbook of Research in the Sociology of Education (pp. 37–63). New York: Kluwer Academic/Plenum.
Gustafsson, J. E. (2003). What do we know about effects of school resources on educational results?. Swedish Economic Policy Review, 10(2), 77-77.
Hill, K., Mirakhur, Z., & Sludden, J. (2020, March 10). Mapping racially representative schools. NYU Steinhardt. https://steinhardt.nyu.edu/research-alliance/research/spotlight-nyc-schools/mapping-racially-representative-schools
Jencks, C. S., & Mayer, S. E. (1990). The social consequences of growing up in a poor neighborhood. In L. E. Lyn & M. McGeary (Eds.), Inner-City Poverty in the United States (pp. 111–186). Washington, DC: National Academy of Sciences.
Kucsera, J., & Orfield, G. (2014). New York State’s extreme school segregation: Inequality, inaction and a damaged future. https://escholarship.org/content/qt5cx4b8pf/qt5cx4b8pf.pdf
Knudson, A. (2022, October 5). See how your school performed on 2022 New York State reading exam. Silive. https://www.silive.com/education/2022/10/see-how-your-school-performed-on-2022-new-york-state-reading-exam.html
Lefty, L. and Lefty, L. (2021) The long fight for educational equity in NYC, Museum of the City of New York. Available at: https://www.mcny.org/story/long-fight-educational-equity-nyc?gclid=CjwKCAjwzNOaBhAcEiwAD7Tb6IS9g3DhbeaFFsmSxGyJ3ccnn3bwuwCQVHV26BJaEG_Rd2CrCRpYUBoCNBsQAvD_BwE
Long, C. (2021, November 8). What is Quality Teaching and How is It Supported?NEA. https://www.nea.org/advocating-for-change/new-from-nea/what-quality-teaching-and-how-it-supported
Modan, N. (2020, January 7). Report: NYC schools remain segregated even within diverse districts. K-12 Dive. https://www.k12dive.com/news/report-nyc-schools-remain-segregated-even-within-diverse-districts/569928/
Martorell, P., Stange, K., & McFarlin Jr, I. (2016). Investing in schools: capital spending, facility conditions, and student achievement. Journal of Public Economics, 140, 13-29.
New York City Department of Education. (2017). Equity and excellence for all: Diversity in New York City public schools. https://www.schools.nyc.gov/docs/default-source/default-document-library/diversity-in-new-york-city-public-schools-english
New York City Council. (2020). School diversity in NYC. Data Team. Retrieved December 21, 2022, from https://council.nyc.gov/data/school-diversity-in-nyc/
Palardy, G. J., High school socioeconomic segregation and student attainment, American Educational Research Journal, 50, no. 4 (2013): 714.
Pfautz, H. W. (1967). Equality of Educational Opportunity. American Sociological Review, Vo1. 32, NO. 3, June, 1967
Page, S. E., (2008), The Difference: How the Power of Diversity Creates Better Groups, Firms, Schools, and Societies, Princeton, NJ: Princeton University Press
Piopiunik, M., Hanushek, E. A., & Wiederhold, S. (2014). The impact of teacher skills on student performance across countries.
Rumberger, R. W., & Palardy, G. J. (2005). Does segregation still matter? The impact of student composition on academic achievement in high school. Teachers college record, 107(9), 1999.
Jones, D.R. (2018, September 20). Career pathways and racial equity: Another way to address school segregation. Community Service Society of New York. https://www.cssny.org/news/entry/career-pathways-and-racial-equity-another-way-to-address-school-segregation
Strauss, V. (2013, October 23). Fifty years ago today, the school boycott that rocked Chicago. The Washington Post. https://www.washingtonpost.com/news/answer-sheet/wp/2013/10/22/fifty-years-ago-today-the-school-boycott-that-rocked-chicago/
Shapiro, E. (2019, March 26). Segregation has been the story of new york city’s schools for 50 years. The New York Times. https://www.nytimes.com/2019/03/26/nyregion/school-segregation-new-york.html
SCARINCI, D. (2015, January 29). Plessy v Ferguson: The Supreme Court’s notorious decision. Constitutional Law Reporter. https://constitutionallawreporter.com/2015/01/29/plessy-v-ferguson-courts-decision/
Sanchez, Adam. (2020, May 17). The largest civil rights protest you’ve never heard of. Rethinking Schools. https://rethinkingschools.org/articles/the-largest-civil-rights-protest-you-ve-never-heard-of/
Thomas, E. (2021, August 3). Racial equity in NYC public schools: Where Brown v. Board still falls short : ICAAD. ICAAD. https://icaad.ngo/2021/08/02/racial-equity-in-nyc-public-schools-where-brown-v-board-still-falls-short/
The Research Alliance for New York City Schools. (2020, March 10). Mapping racially representative schools. NYU Steinhardt. https://steinhardt.nyu.edu/research-alliance/research/spotlight-nyc-schools/mapping-racially-representative-schools
The 1963 Chicago public schools boycott. (2019, February 1). Facing History and Ourselves. https://www.facinghistory.org/resource-library/10-questions-past-1963-chicago-public-schools-boycott
User, G. (2016, October 4). The origins of “antibusing” politics: New York City protests and revision of the Civil Rights Act — The Gotham Center for New York City History. The Gotham Center for New York City History. https://www.gothamcenter.org/blog/the-origins-of-antibusing-politics-new-york-city-protests-and-revision-of-the-civil-rights-act
US Department of Education. (2016). The state of racial diversity in the educator workforce. https://www2.ed.gov/rschstat/eval/highered/racial-diversity/state-racial-diversity-workforce.pdf.